Dashboard
The Dashboard is its own section in Moterra, available from the left-hand sidebar next to Admin Portal. It's where administrators can review usage analytics, cost, and platform insights across the organisation. It gives visibility into adoption, activity, agent usage, and how your organisation is using AI — all in one place.
Written By Kristė Vagnerytė
Last updated About 2 months ago
What the Dashboard is used for
The Dashboard allows administrators to:
Track user adoption and activity trends
Monitor overall platform cost (AI usage and infrastructure)
See which AI assistants and custom agents are used most
Review Knowledge Base indexing status and storage
Understand how AI is being used across the organisation through categorised use cases
The Dashboard is organised into five tabs: Overview, Users, AI Insights, Agents, and Use Cases.
Selecting a date range
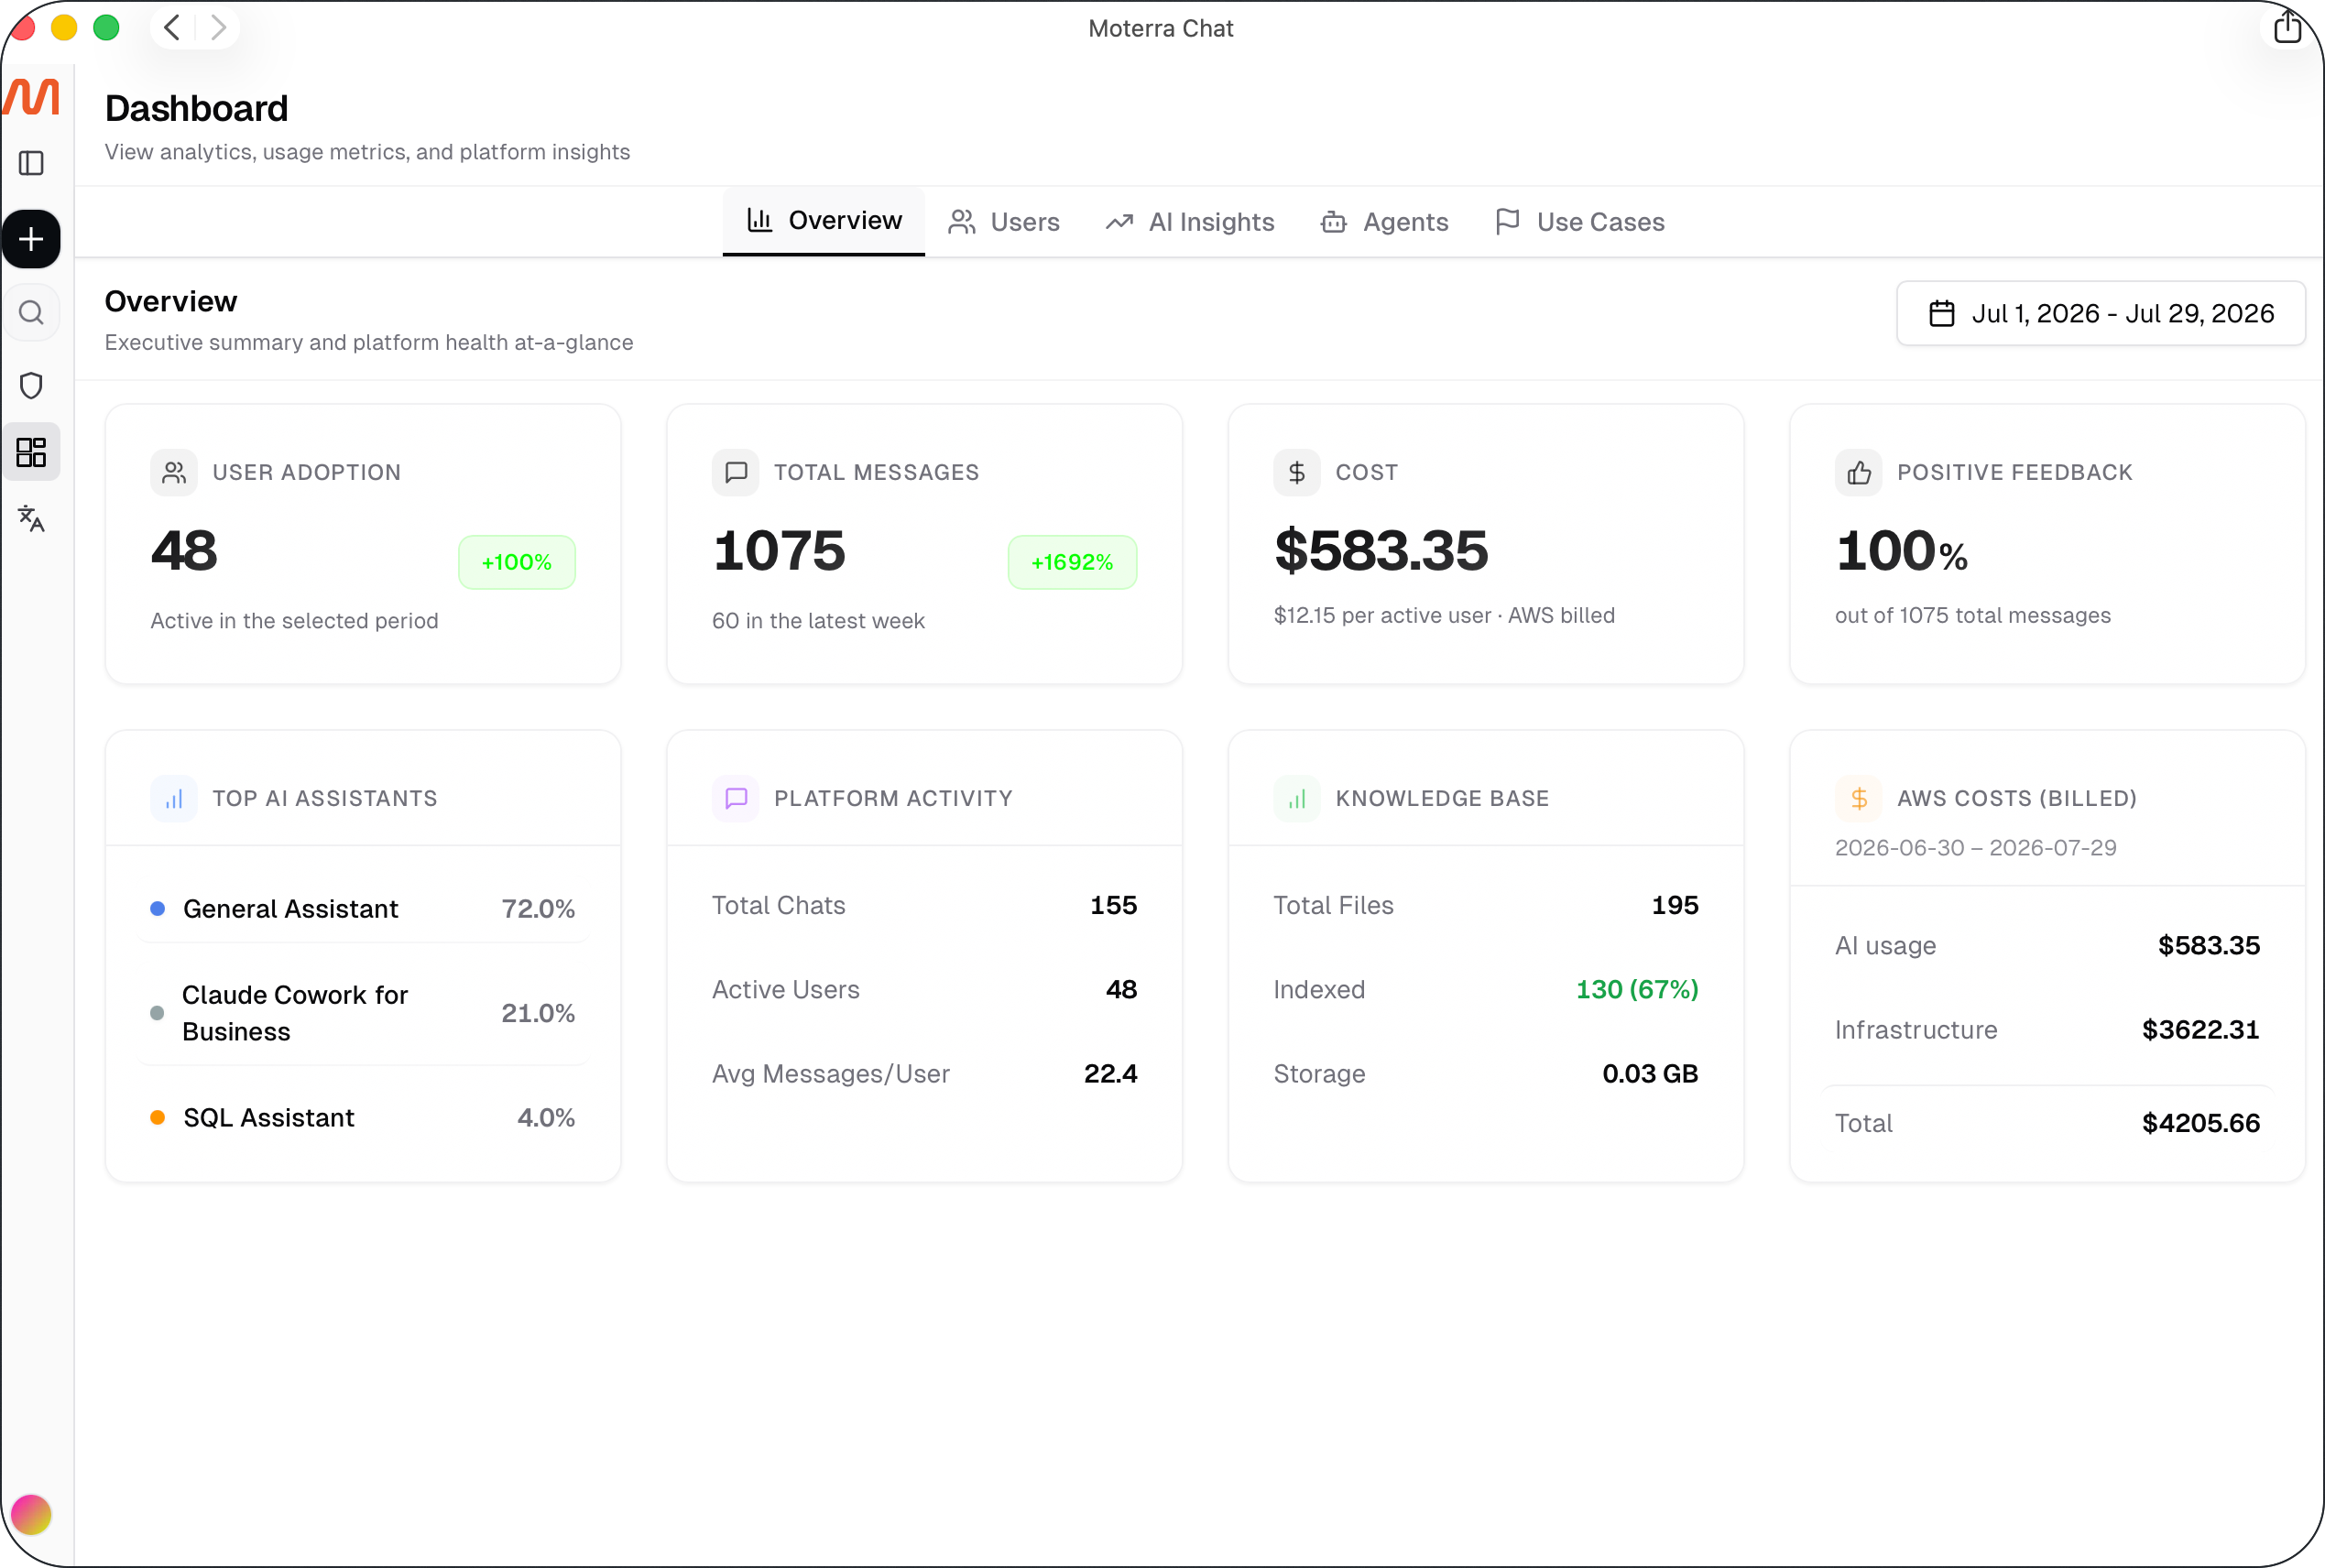
All tabs share the same date range picker in the top-right corner. Use it to view metrics for the current month or a custom period. Figures across the Overview, Users, and Agents tabs update based on the selected range.

Overview tab
The Overview tab gives a snapshot of platform health for the selected period.
Top metrics:
User Adoption – number of active users in the selected period, with the change compared to the previous period
All Messages – total messages sent in the period, including how many were sent in the last week
Cost – total AI usage cost for the period, and cost per active user, based on your AWS invoice
Positive Feedback – percentage of messages that received positive feedback, out of all messages
Summary panels:
Most Popular AI Assistants – share of conversations by assistant (e.g. General Assistant, Custom Agents, SQL Assistant)
Platform Activity – total conversations, active users, and average messages per user
Knowledge Base – total files, how many are indexed (and the indexing %), and storage used
AWS Costs (Invoice) – a breakdown of AI usage cost vs. infrastructure cost for the billing period, plus the combined total
Users tab
The Users tab focuses on user-level engagement.
Top metrics:
Active Users – number of active users in the period (and as a % of total users)
New Users – users who joined in the selected period
Total Conversations
Avg. Messages per User
Conversation split shows the share of public vs. private conversations.
User Activity Details lists, per user: messages, conversations, input tokens, output tokens, total tokens, estimated cost for the period, current usage-limit consumption, status, and last activity. Use this table to spot heavy users, users approaching their usage limit, or inactive accounts.
AI Insights tab
The AI Insights tab focuses on AI performance, model usage, cost, and response quality.
Top metrics:
Cost – total AI usage cost for the period, and cost per active user, based on your AWS invoice (same figure as on the Overview tab)
Response Quality – percentage of responses rated positively, based on user feedback votes
Total Tokens – combined tokens used across all models in the period
Summary panels:
Agent Type Usage – share of cost and usage by assistant/agent type (e.g. General Assistant, Custom Agents), shown as a breakdown with cost per type
Model Usage – share of tokens/cost by underlying AI model (e.g. Claude Opus, Claude Sonnet), shown as a breakdown with cost per model
Flagged Messages & Feedback lists responses that received negative feedback, so you can review and improve quality. Each row shows the message, the chat it belongs to, and the user who flagged it.
Use this tab to understand not just how much AI is being used, but how well it's performing and which models are driving cost.
Agents tab
The Agents tab shows usage broken down by AI assistant and custom agent.
Top metrics:
Active Agents – number of agents used in the period
Total Tokens – combined tokens across all agents
Cost – approximate cost across all agents
Agent Usage Breakdown lists each agent with its total tokens and cost. Click an agent to expand it and see a per-user breakdown (messages, input/output/total tokens, and cost) for that agent.
Use Cases tab
The Use Cases tab automatically groups conversations into categories, showing how AI is creating value across the organisation.
Use the search bar to find a specific category or use case
Click Generate to refresh the categorisation based on recent conversations
Each category shows the number of cases, when it was last updated, how many users contributed, and estimated time saved
This view is useful for identifying the most common ways teams use Moterra, and for building a business case around AI adoption.
Who can access the Dashboard
The Dashboard is a separate sidebar section from the Admin Portal, but it follows the same access rules:
Admins have full access to all Dashboard tabs
Regular Users do not have access to the Dashboard or the Admin Portal